Deprecated: Methods with the same name as their class will not be constructors in a future version of PHP; ErrorHandler has a deprecated constructor in /home/ifa5ihag8ocn/domains/a-i-inc.com/html/classes/ErrorHandler.php on line 12
Notice: Undefined variable: errorEmailAddress in /home/ifa5ihag8ocn/domains/a-i-inc.com/html/classes/ErrorHandler.php on line 54
Notice: Undefined index: name in /home/ifa5ihag8ocn/domains/a-i-inc.com/html/globalConfig.php on line 24
HOME
Home
Visit Our Partners
|
Home > Technology & Applications > Wireless Chemical Sensor MonitoringWireless Chemical Sensor Monitoring
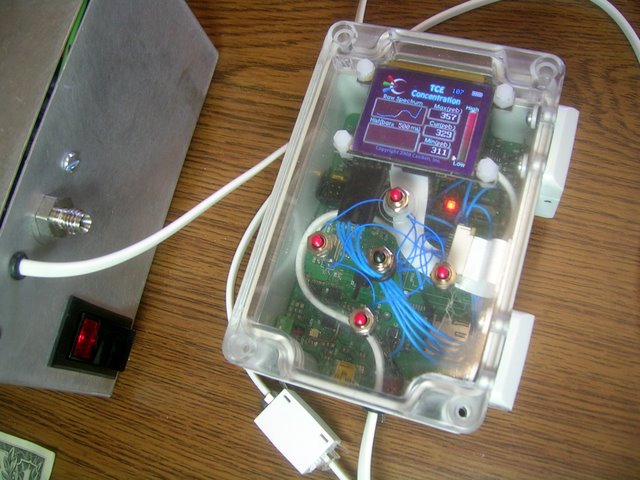
The Autonomous Innovations, Inc logger/control board can be used to control, monitor and log one or more Caviton or other wireless sensors. The logger/control board has an ARM Cortex-M3 processor with 64 KB of flash and 8 KB of RAM. The choice of ARM architecture opens up the possibility of a wide range of optional commercial processors and memory capacities, or even a custom FPGA with ARM Cortex-M1 processor. The board has a USB port for connection to a PC, and for charging the internal lithium polymer battery. It has a battery-backed real time clock, and I2C and SPI buses for direct attachment of a variety of optional sensors. It directly accommodates sensors for measurement and logging of 3-axis accelerations, pressure, temperature and humidity. The board has a swappable wireless module which can support IEEE 802.15.4, ZigBee, or a very low power, low overhead communications protocol. It can also be configured with Bluetooth wireless. It has a micro-SD flash socket for storage of customization files and for logging of up to 2 GB of sensor data. For user interaction, it has a 160x128 smart OLED color display with its own 1 GB of flash for storage of bitmaps, fonts, animations and custom graphics. User input can be as simple as a single pushbutton, or a more capable optional lighted scrollwheel with 5-way switch for integrated scrolling, directional navigation and push button selection.
Below is a close-up picture of the summary screen for the Mercury sensor, displaying
live sensor data, including a slice of the raw spectrum, Min/Max/Current
concentrations, and a scrolling history of concentrations. 
|
Sign-up to receive news about our embedded sensor solutions. |
|
Embedded Sensor Solutions |

 A hard-wired version of the logging device was recently created for