Notice: Undefined variable: errorEmailAddress in /home/ifa5ihag8ocn/domains/a-i-inc.com/html/classes/ErrorHandler.php on line 54
Notice: Undefined index: name in /home/ifa5ihag8ocn/domains/a-i-inc.com/html/globalConfig.php on line 24
HOME
Home
Visit Our Partners
|
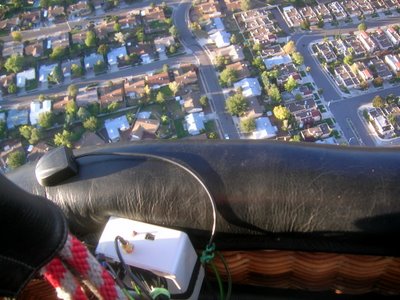
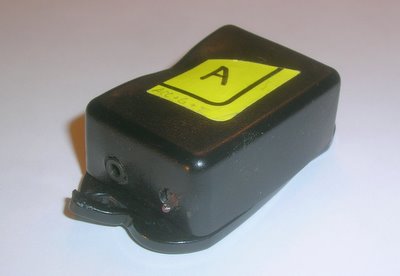
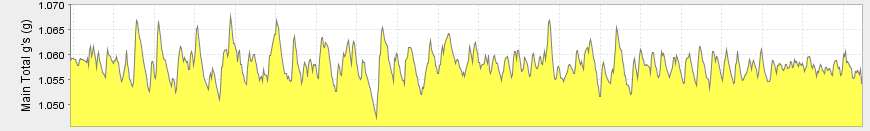
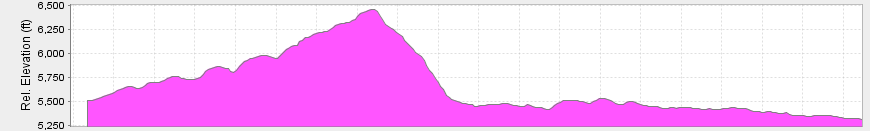
Home > Sports Applications > Logger Board ExamplesHot Air BalloonOct 5, 2007Here's some detailed information logged from a hot-air balloon trip as part of the Albuquerque Balloon Fiesta 2007. The logger board was attached to the basket, and a wireless remote was attached inside the top of the balloon. Furthermore audio data was captured from the flight and later used to generate a burn-track indicating when the burners were fired.
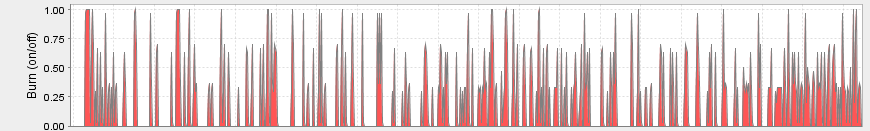
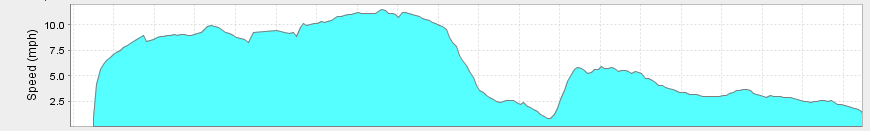
Things to notice here, are how the burn data corresponds with changes in vertical
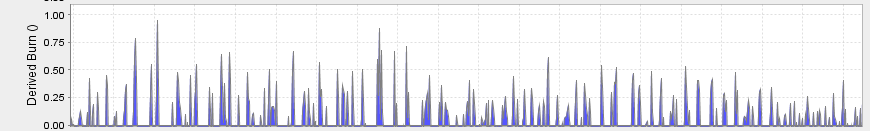
speed, and the g-forces on the basket. Also note the Derived Burn data, which was
created from the accelerometer in the basket, and how well it corresponds with
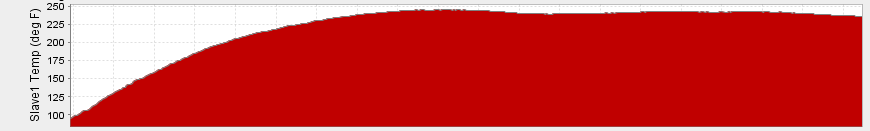
the audio-based Burn data. The graph titled 'Slave1 Temp' is the temperature
inside the top of the balloon. Our plastic case couldn't quite handle the constant 240+
degree (F) temperatures inside the balloon, and deformed quite a bit. However,
it did continue logging through the great majority of the flight. We're now
searching for a better case that can remain sealed while accurately measuring temperatures
outside the case.
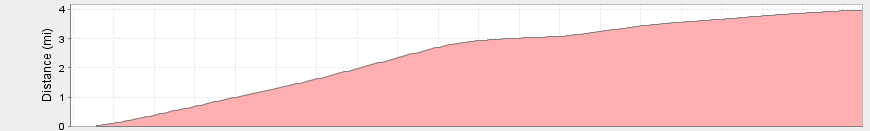
The track can be viewed in Google Earth by clicking here. This file contains tracks from two balloons that we were logging. The color of the track indicates the speed and the height from the ground is actual elevation data for each balloon. The 'Just in Case' balloon has an additional track over it indicating when the burners were fired, which appear as white dashes above the track. Graphs and pictures are included as well. We would like to thank Mike Braddock, pilot of the 'Just in Case', and David (Pilot) and Carol LaRotonda of the 'Aerotonda' for taking us up in their balloons with all of our gadgets! The graphs below are from the 'Just in Case' and can be re-arranged by clicking and dragging up/down. |
Sign-up to receive news about our embedded sensor solutions. |
||
|
Embedded Sensor Solutions |