Notice: Undefined variable: errorEmailAddress in /home/ifa5ihag8ocn/domains/a-i-inc.com/html/classes/ErrorHandler.php on line 54
Notice: Undefined index: name in /home/ifa5ihag8ocn/domains/a-i-inc.com/html/globalConfig.php on line 24
HOME
Home
Visit Our Partners
|
Home > Sports Applications > Logger Board ExamplesGait AnalysisOct 17, 2007The graphs below are zoomed in on the X, Y, and Z accelerometer readings of someone walking and then jogging with the logger board on their back. For reference, X is forward/backwards, Y is left/right, and Z is up/down. The first chart is walking, and the second is jogging. Also, we have drawn in vertical red lines to help isolate each step. It's interesting how the forward motion when walking is made up of the short bursts with each step, despite the relative constant motion that it feels like. The left and right of the alternating steps is not very noticable when walking, but quite obvious when jogging. 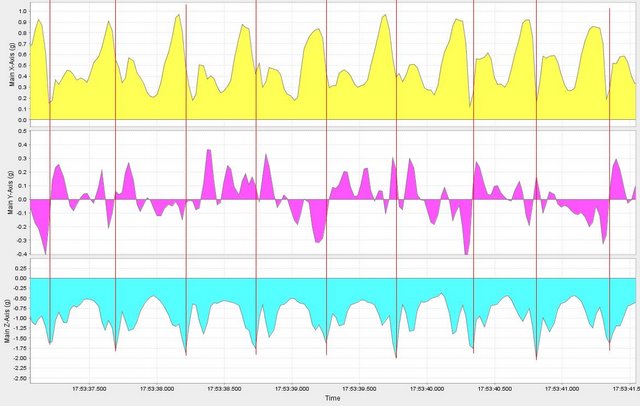

|
Sign-up to receive news about our embedded sensor solutions. |
|
Embedded Sensor Solutions |