
Notice: Undefined variable: errorEmailAddress in /home/ifa5ihag8ocn/domains/a-i-inc.com/html/classes/ErrorHandler.php on line 54
Notice: Undefined index: name in /home/ifa5ihag8ocn/domains/a-i-inc.com/html/globalConfig.php on line 24
HOME
Home
Visit Our Partners
|
Home > Sports Applications > Logger Board ExamplesActivity ComparisonThe graph below shows a comparison of the intensity of the g-forces endured during various activites, both for rider and ride.
The values shown are multiples of the standard deviation (stdDev) for each activity, which gives a good indication of overall shock intensity. On average for our data sets, about 80% of the time falls within 1 stdDev, 15% falls within 2X stdDevs, 3% falls within 3X stdDevs, and the remaining 2% fall between 3X stdDevs and the maximum sustained g-force. 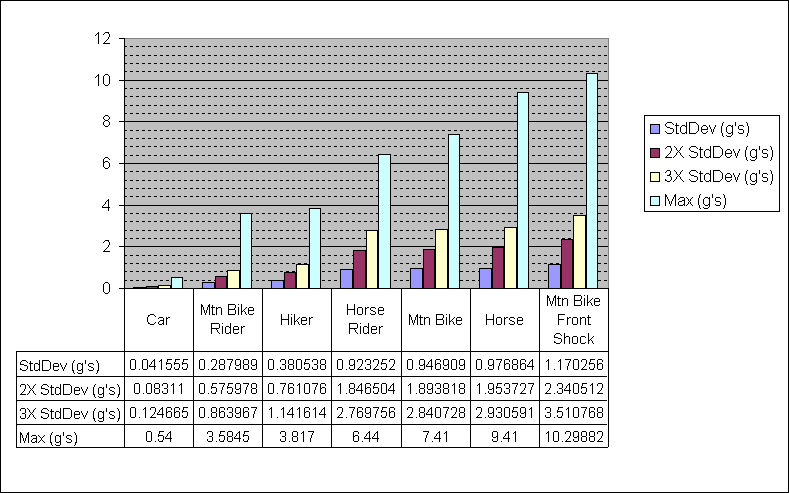
Here's a brief description about each activity listed above:
|
Sign-up to receive news about our embedded sensor solutions. |
|
Embedded Sensor Solutions |